Fixing 99% CPU usage in gRPC service
Setting the Crime Scene
We are back again in gRPC service and this time we will be working on another performance issue. These kind of issues comes under the radar very easily when you are dealing with long-lived, high performant and heavily used service that is running for ages. Back in old days it was easy to set recycling options for IIS and all of the sudden your memory, CPU or any other issues are auto-magically gone. Here in our case - gRPC service has to run for days, weeks, maybe even months without any interruptions. Maintaining service with these constraints becomes frankly interesting and challenging.
Observing the Issue
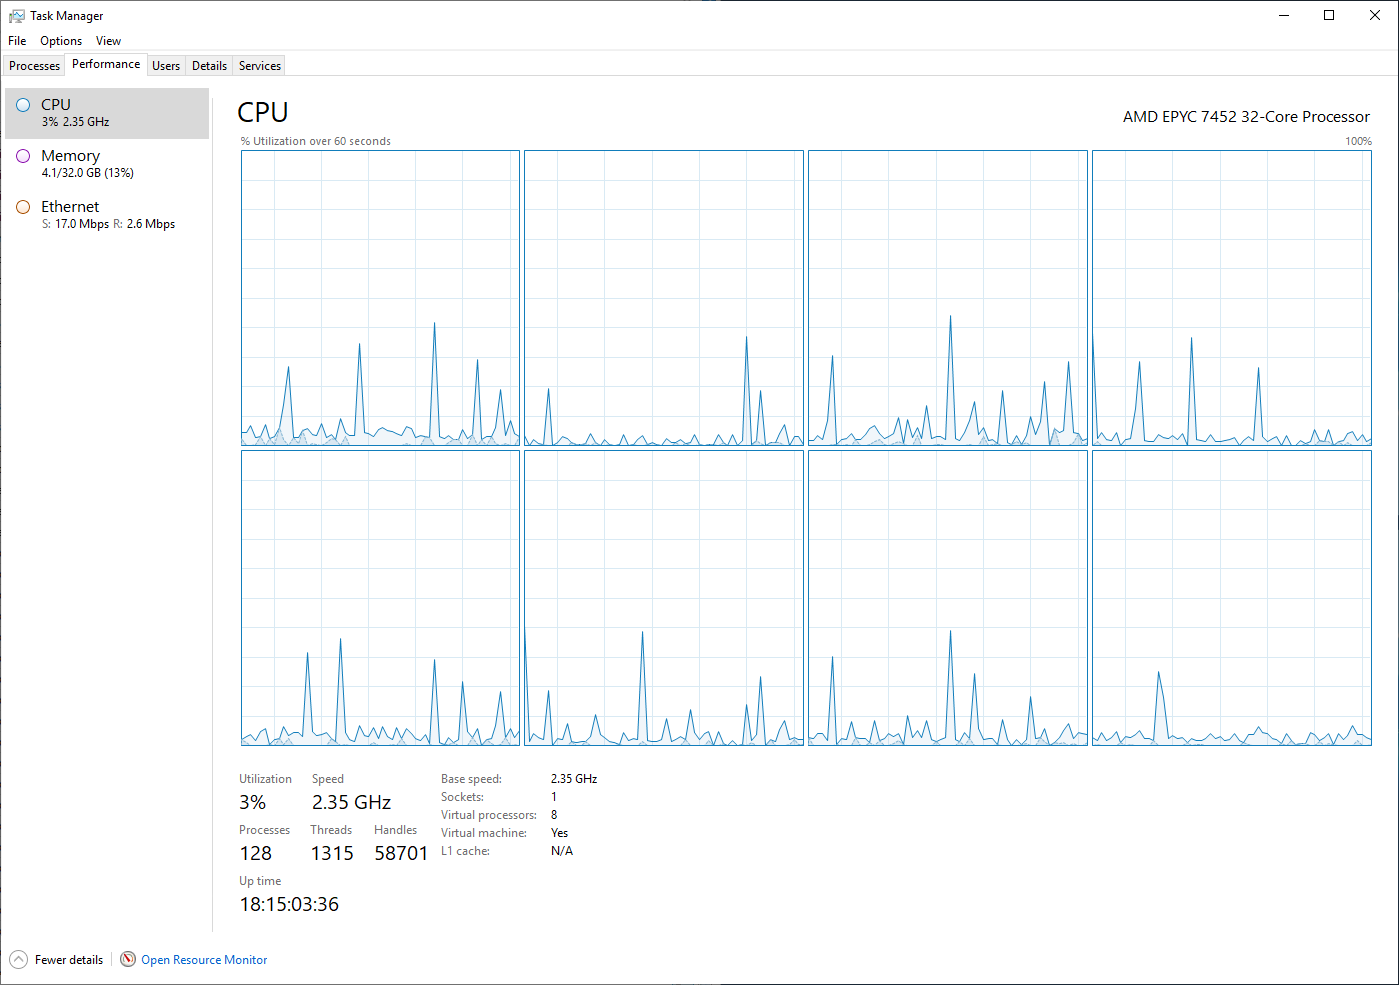
This time we had to deal with super high CPU usage by our gRPC service. We were expecting to see normal behavior and resource usage by the service - something like this over the time:
But, after few days of uptime - we were stuck with this picture from Task Manager:
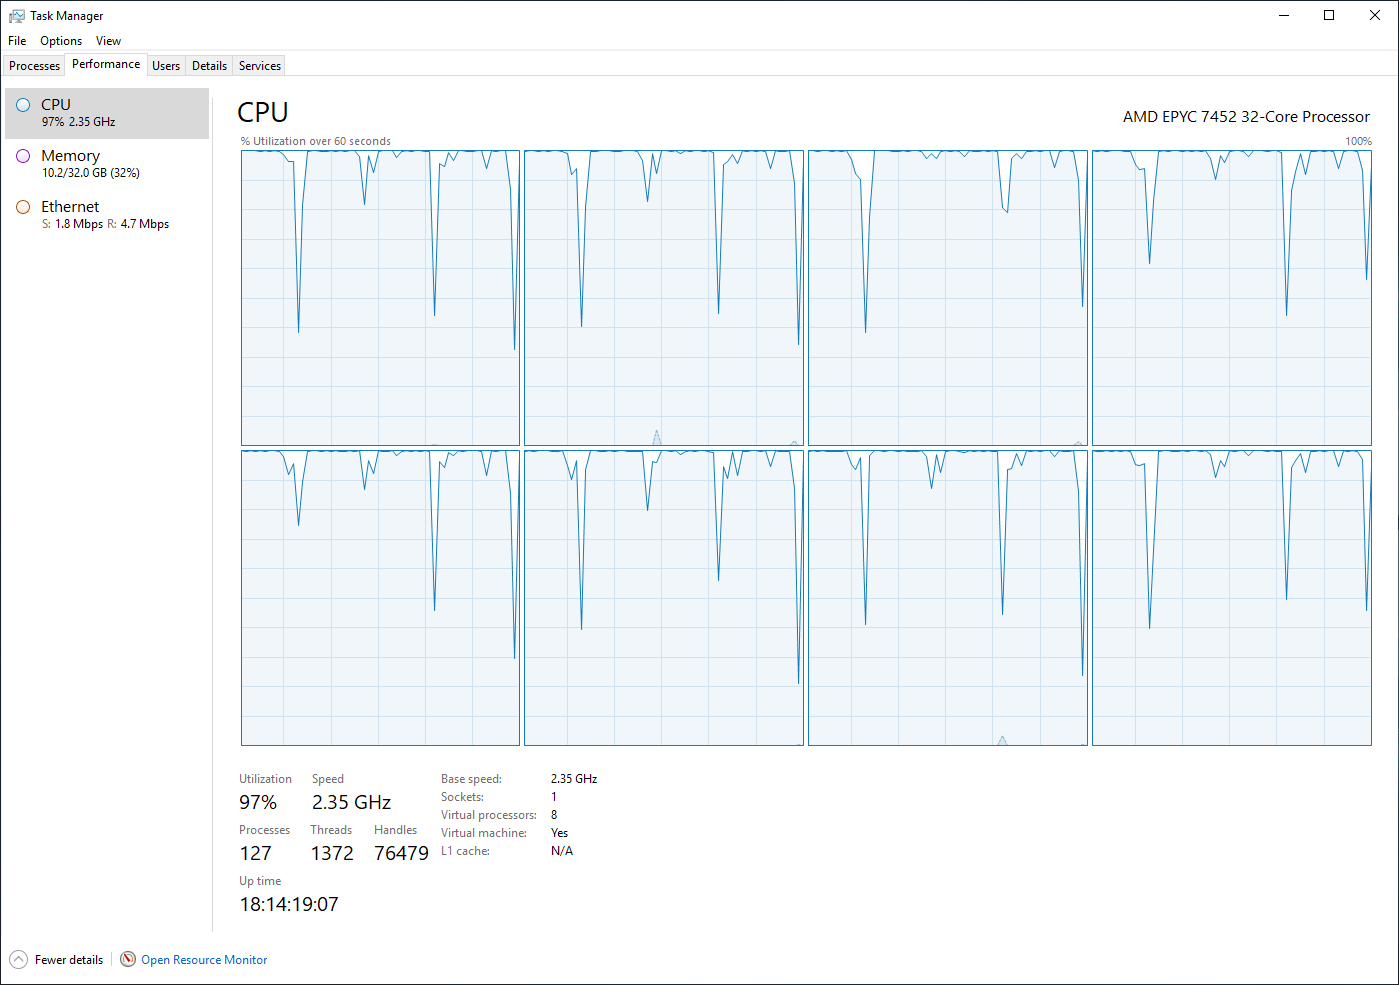
Interesting fact here is that this behavior starts to appear only after running for a few days. Which means that something is leaking somewhere and it leaks only under specific concrete conditions.
Collecting Trace
What we can start with - collecting some traces from the running process. For this to happen - we have to install .NET Diagnostic Tools.
Let’s start with counters.
1
> dotnet tool install --global dotnet-counters
First, we need to find applicable process ID for the gRPC service.
1
> dotnet-counters ps

When found we can start counter monitor to see some of the indicators without collecting any process data yet.
1
> dotnet-counters monitor --refresh-interval 1 -p 4352
This opens old school command prompt style diagnostics panel.
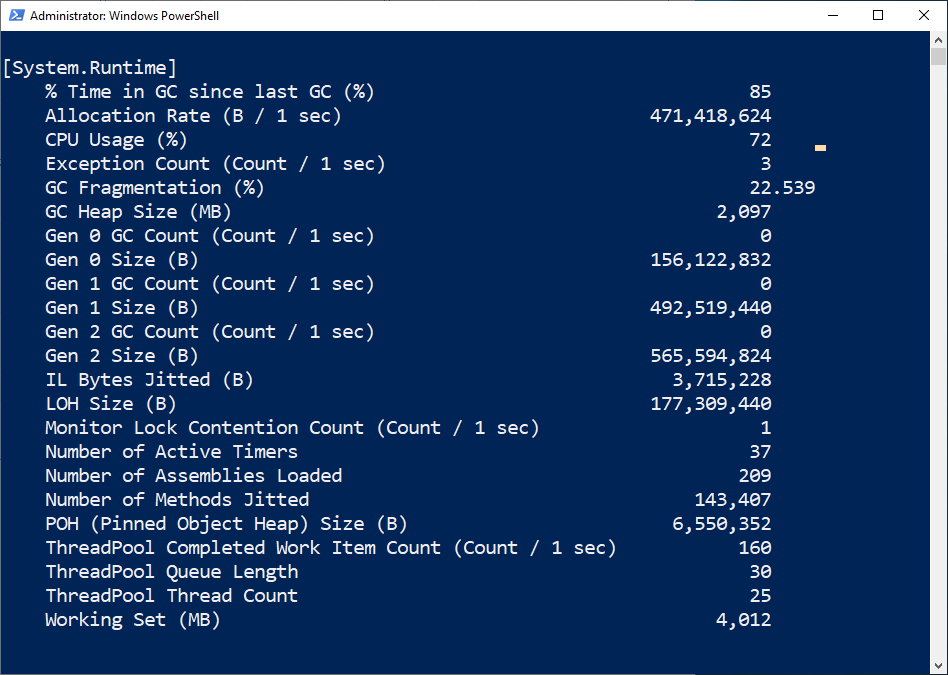
Counters are collected every second (set by refresh-interval argument) and values are displayed on the screen.
Looking at counter data over the time - we saw that allocation rate increases, CPU usage increases, GC numbers go up.
But overall ~450MB allocation per second is not a good sign of healthy service (unless you expect it and the service is designed for that).
Next step is to collect some data that we could use to analyze in more details what’s going on and where to start to look for the issue root cause.
For this - we will need another global tool.
1
> dotnet tool install --global dotnet-trace
After trace tool is installed we can start collecting sample data (recommended us to run this tool exactly when you have observed issues with the application):
1
> dotnet-trace collect -p 4352 --providers Microsoft-DotNETCore-SampleProfiler
Let it run for some time (I was collecting data for about 1 minute). After you complete trace session trace.nettrace file will be written to the disk (tool will let you know exact location).
I usually copy over trace file along with whole application directory to some local machine so I can analyze uninterrupted and off from production environment.
Analyzing Trace Using PerfView
Once we have all the files on local machine you will see following screen after opening trace file with PerfView.
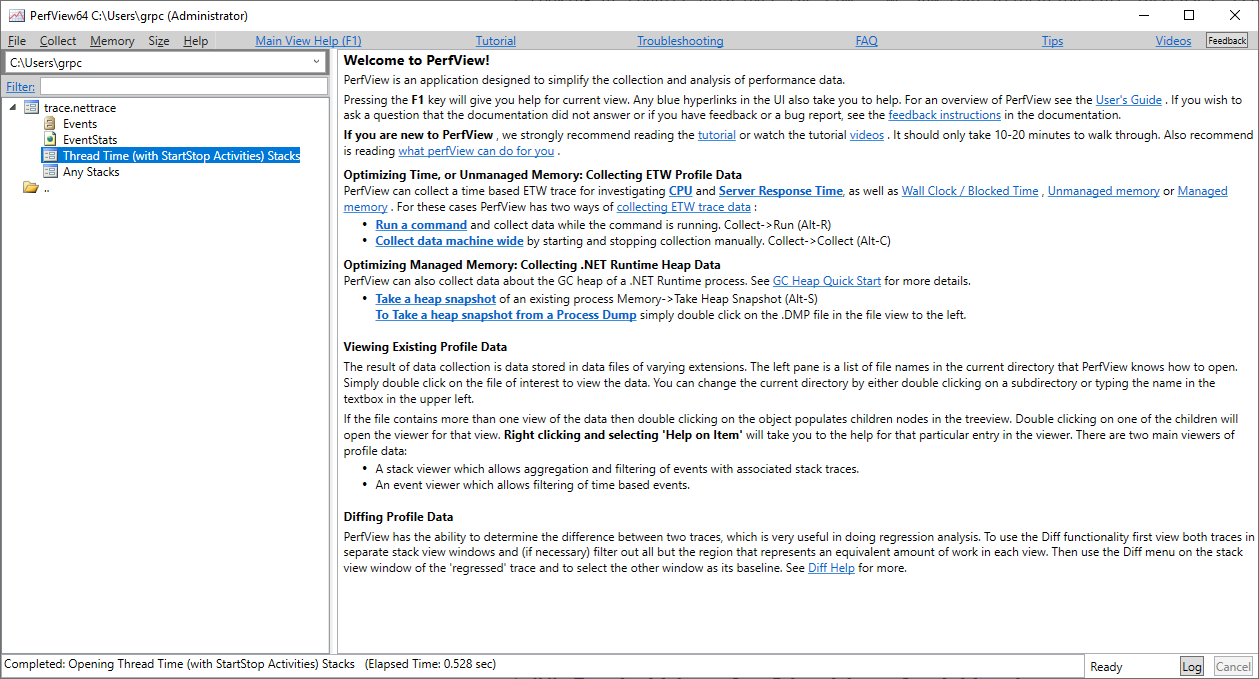
This is landing page of the PerfView.
Thread Time (with StartStop Activities) Stacks is a good start to browse around collected data.
Double click on it and it will open more detailed view (I had to blur some of the method and type names not to expose project specific details).
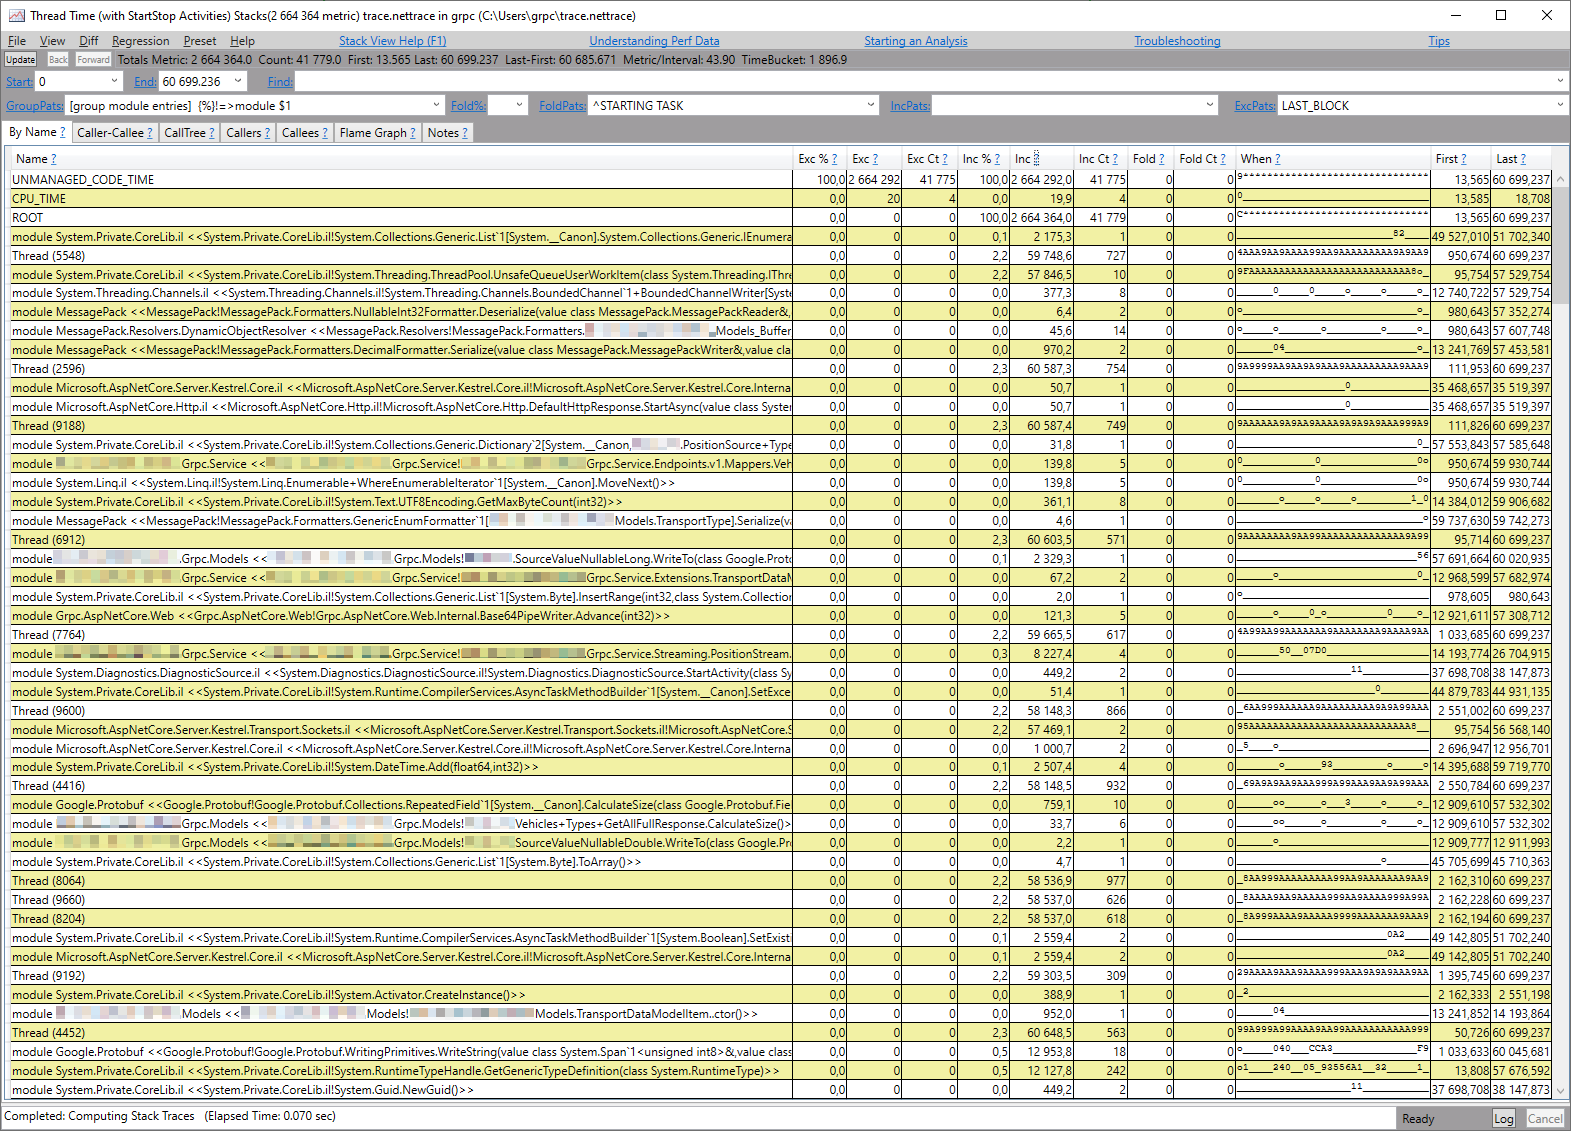
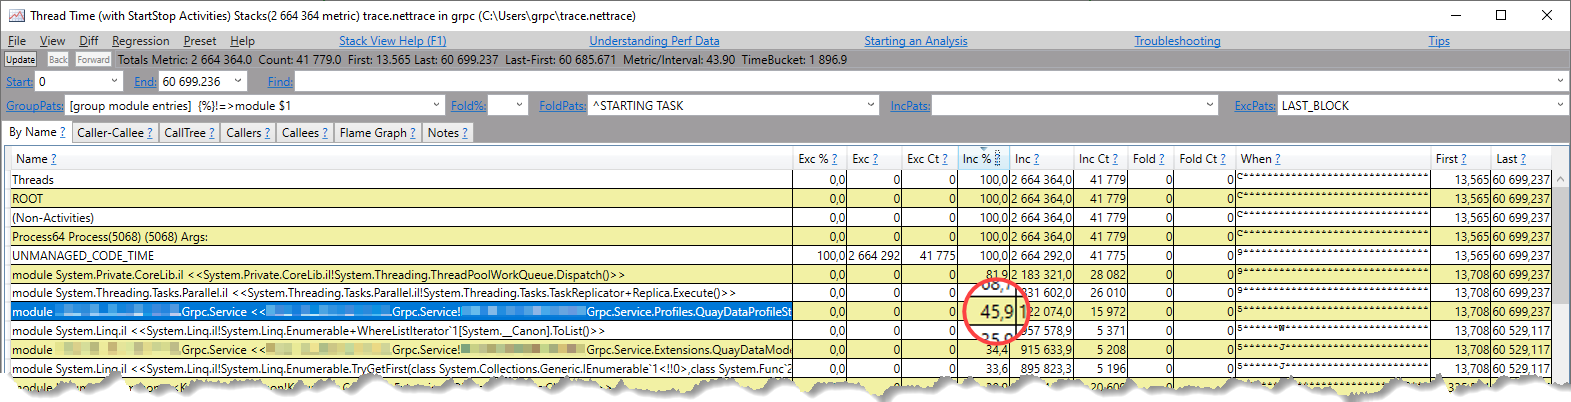
Next we can sort by "Inc %" column and inspect who is on top (Inc % - inclusive cost expressed as a percentage of the total cost of all samples).
Interesting that 1st “My Code” method which takes super huge amount of time during sampled period is "PostProcess" method from the Quay endpoint. CPU usage of 45% for something so simple as processing 5000 items almost every second is REALLY suspicious.
Revisiting Application Architecture
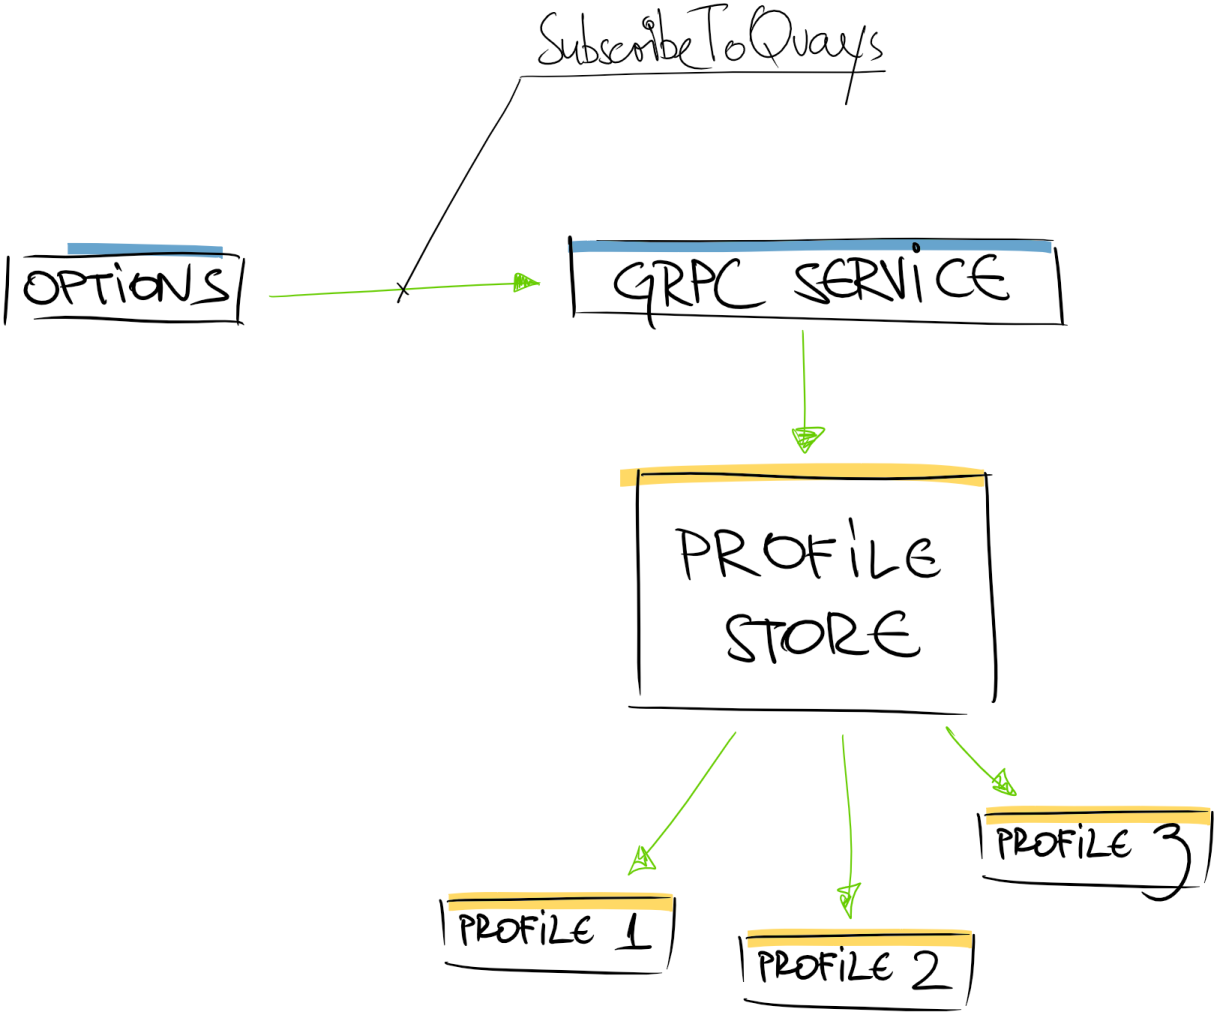
So let’s revisit what is Quay endpoint and where it’s used.
We do have SubscribeToQuays endpoint method in our gRPC service. This method is responsible for the few things:
- accepting request options describing what kind of data particular subscriber is interested in (
RequestOptions).RequestOptionsis a POCO class carrying various settings for the subscribe method invoke. For example, using options parameter I can subscribe to simple view of the quays - like name, coordinates and transport type for the quay; - passing
RequestOptionsdown toProfileStorefor profile calculation; ProfileStorehowever is responsible to calculate combination ofRequestOptionsparameters and understand whether this is something brand new or we already have this profile inProfileStore;- List of generated profiles is stored in
ConcurrentDictionary<>with key ofRequestOptionsitself.
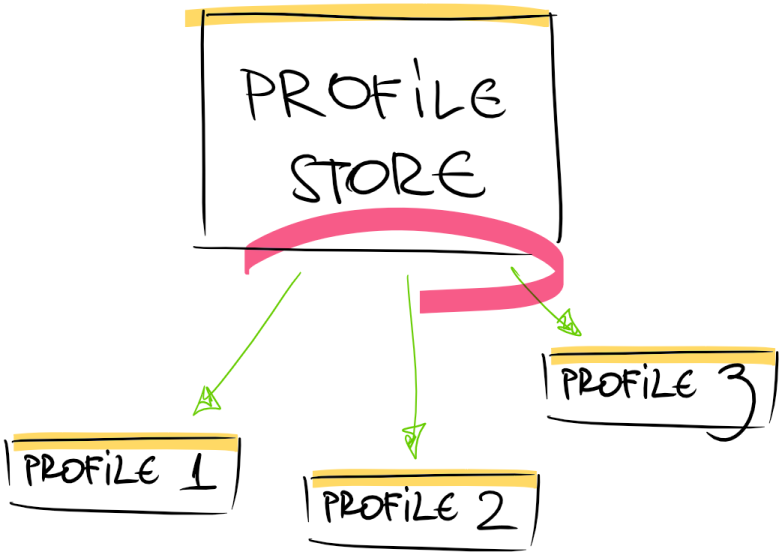
This is high level inner workings of the ProfileStore:
When incoming data about transport positions (and other metrics) is received from ServiceBus MessageReceiver (variable AllData) - it is passed over to profile store for the individual profile data projection. In order to keep performance at the required level - it was decided to clone AllData content and run various processors and filters for each profile’s copy of the data. This means that if we do have 3 distinct profiles in store - 3 copies of transport data will be created (each for every profile). RequestOptions potential combinations of property values is low enough - so theoretically in our case max profile count can reach only 12. Knowing size of the AllData content and potential profile count - we made decision to copy data.
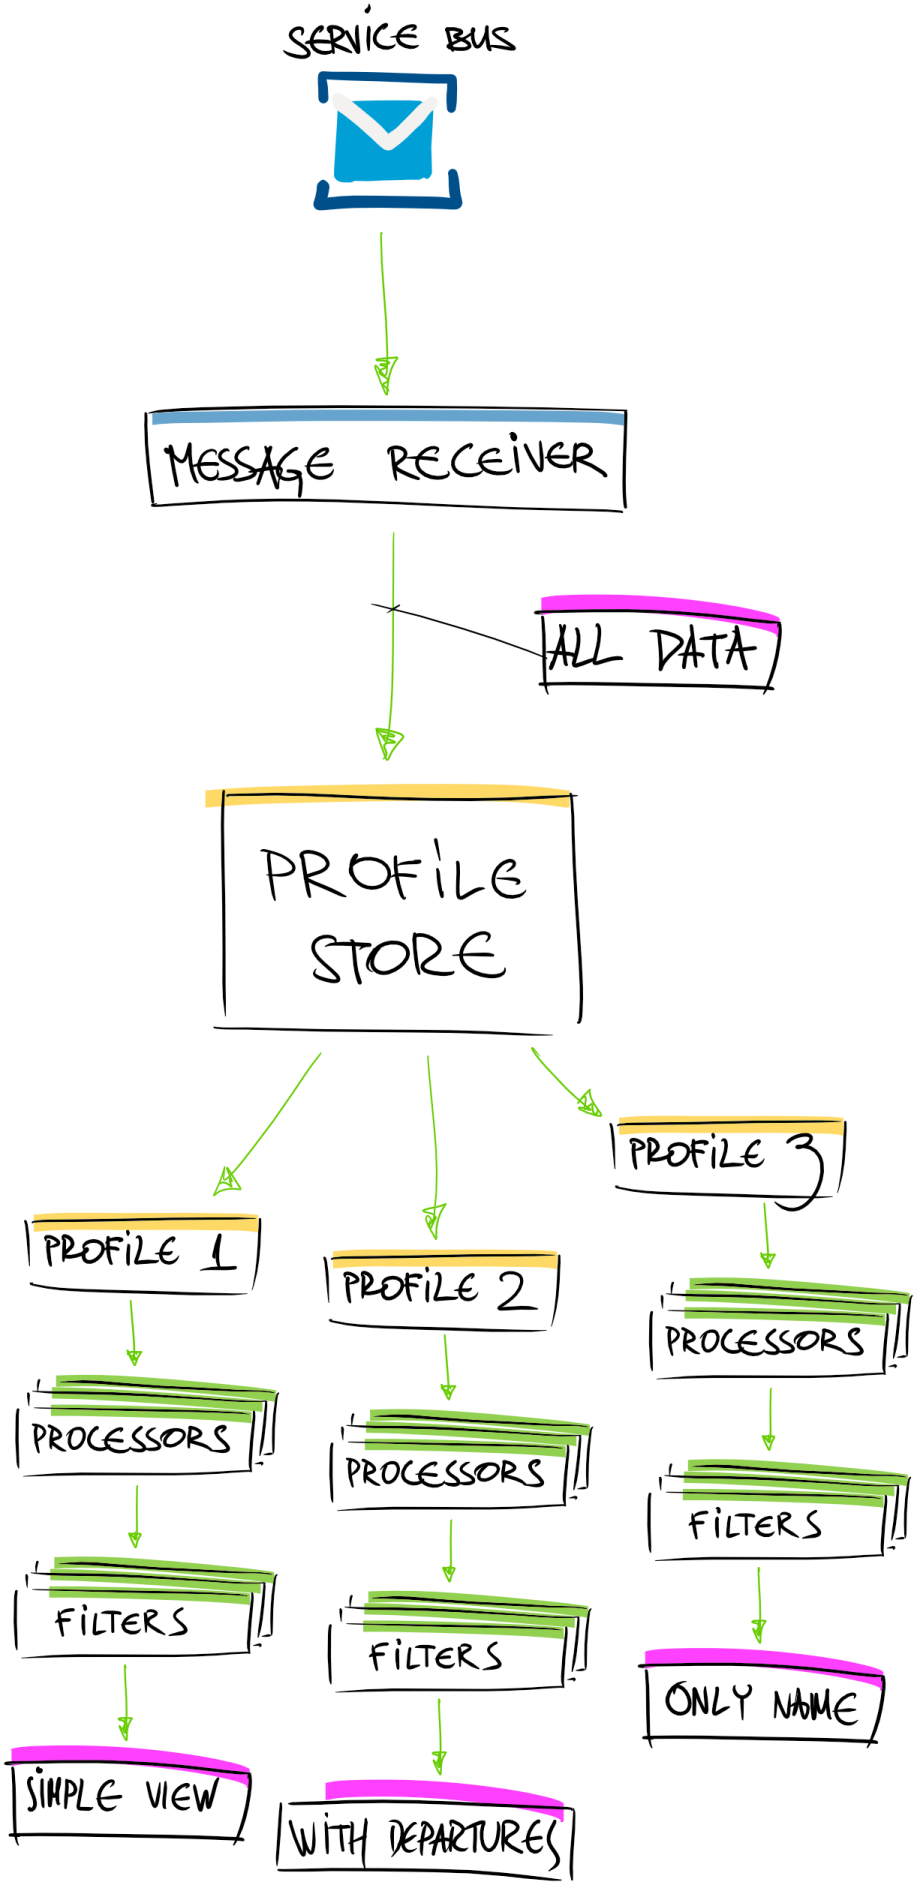
NB! We see that count of the profiles directly affects amount of used memory and required processing power to calculate projected transport data for that profile.
To illustrate ProfileStore responsibilities here is small code sample of how this should be working:
1
2
3
4
5
6
7
8
9
10
11
12
13
14
15
16
17
18
19
20
21
22
23
24
25
26
27
public class RequestOptions
{
    public bool IncludeCoordinates { get; set; }
    public bool IncludeName { get; set; }
    public TransportModeOptions TransportModeOptions { get; set; } = new();
}

public class TransportModeOptions
{
    public bool IncludeAll { get; set; }
}

public class ProfileStore
{
    private ConcurrentDictionary<RequestOptions, QuayProfile> _profiles
        = new(new RequestOptions());

    public void RegisterProfile(RequestOptions options)
    {
        if (!_profiles.Contains(options))
        {
            _profiles.Add(new QuayDataProcessingProfile(options));
        }
    }

    public int ProfileCount => _profiles.Count();
}
In order to add proper support for if (!_profiles.Contains(options)) we have to implement IEqualityComparer<RequestOptions> interface (we are constructing ConcurrentDictionary<> using our comparer).
1
2
3
4
5
6
7
8
9
namespace System.Collections.Generic
{
  public interface IEqualityComparer<in T>
  {
    bool Equals(T? x, T? y);

    int GetHashCode([DisallowNull] T obj);
  }
}
This is equality comparison implementation (or part of it):
1
2
3
4
5
6
7
8
9
10
11
12
13
14
15
16
17
18
19
20
21
22
23
public class RequestOptions : IEqualityComparer<RequestOptions>
{
    public bool IncludeCoordinates { get; set; }
    public bool IncludeName { get; set; }
    public TransportModeOptions TransportModeOptions { get; set; } = new();

    public override bool Equals(object obj)
    {
        return Equals((RequestOptions)obj);
    }

    public bool Equals(RequestOptions x, RequestOptions y)
    {
        ...

        if (!TransportModeOptions.Equals(x.TransportModeOptions))
        {
            return false;
        }

        return true;
    }
}
Basically we are comparing 2 objects and returning true if all the properties are the same; otherwise false.
Below is code fragment that should verify behavior of the ProfileStore.
1
2
3
4
5
6
7
8
9
10
11
12
13
14
15
16
17
18
19
20
21
22
23
24
25
26
27
28
29
30
[Fact]
public void RegisterTwoSimilarProfiles_ShouldBeOne()
{
    var sut = new ProfileStore();

    var p1 = new RequestOptions
    {
        IncludeCoordinates = true,
        IncludeName = true,
        TransportModeOptions =
        {
            IncludeAll = false
        }
    };

    var p2 = new RequestOptions
    {
        IncludeCoordinates = true,
        IncludeName = true,
        TransportModeOptions =
        {
            IncludeAll = false
        }
    };

    sut.RegisterProfile(p1);
    sut.RegisterProfile(p2);

    sut.ProfileCount.Should.Be(1);
}
Unit tests were green! We are ready to roll further.
However from PerfView we see that we spend a lot of time preparing data for the profiles.
Next step should be to verify how much time takes to process incoming transport data for a profile. After setting up infrastructure for that and running few sample runs - we saw that time is measured in milliseconds and CPU usage is not that high.
Now we have to ask ourselves two questions:
- Why does data preparation for quay profiles take so much time?
- And why this happens only after few hours or even days of gRPC service uptime?
To answer first question - during peak (or particularly hard time for the gRPC service) I took memory dump of the process. We could look into the memory footprints and maybe find something interesting there.
Analyzing Half-Dead Process Memory Dump
Btw, how to take a dump I described in previous post of these series here.
I already did that and opened .dmp file in Visual Studio 2022 Preview 2.1 (it’s quite snappy to be honest).
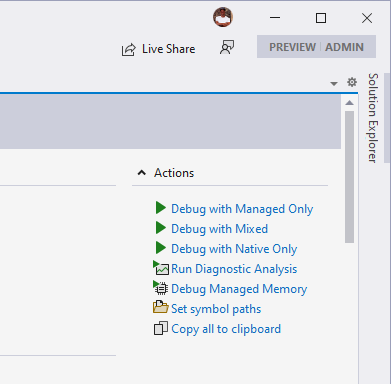
We have to start with Debug Managed Memory:
It might take some time to calculate all GC roots and other information from the dump file - so be patient.
Parallel Stacks is really useful view on the data - showing you what’s happening in your parallel code (async + await and friends). Looking at parallel stack - I noticed that our famous ProfileStore is doing a lot of work and it’s spread across many (really many for that amount of data and potential count of profiles) threads.
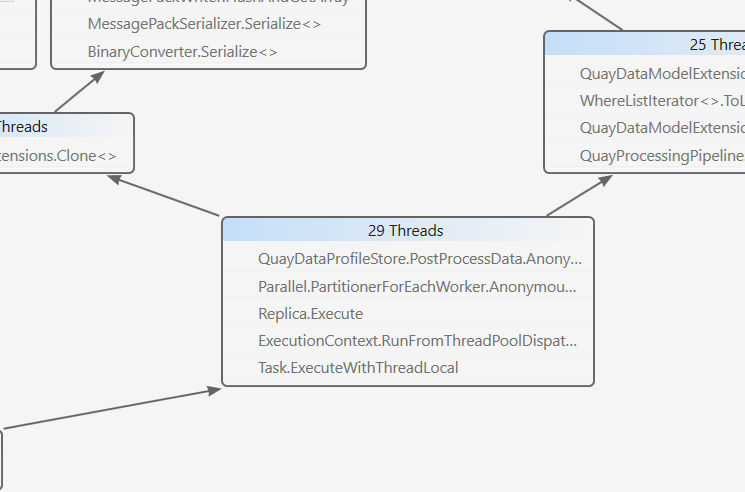
Data preparation happens in parallel for each profile - this can help speed up overall data slicing and profile projection preparation process.
But doing it over 29 threads (at the moment of dump collection) is WAY TOO MUCH!
So - related question is what about count of active profiles? To answer this question - we have to look into memory snapshot and find some details about ProfileStore.
Summary screen already is highlighting some of the details that might be interesting for us:
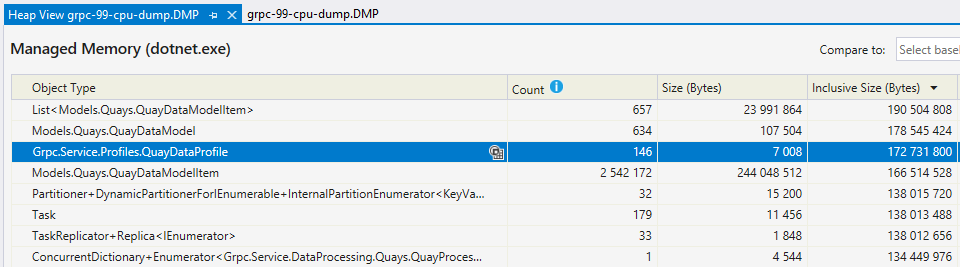
Summary window (ordered by Inclusive Size (Bytes) column) shows that we do have 146 instances of QuayDataProfile items. QuayDataProfile is basically value in _profiles dictionary.
This means that we have 146 active profiles!!! Which again is WAY TOO MUCH (like it’s even physically not possible to generate so much profiles)!
Let’s verify again by finding this dictionary somewhere on the stack:
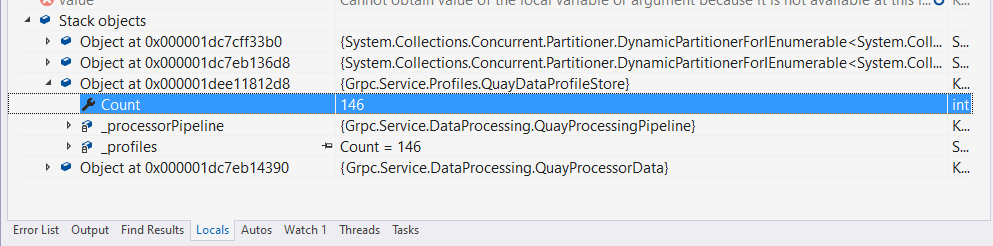
Ok, we have verified that we do have pretty high number of active profiles. Also keeping in mind that we do transport data snapshot clone for each profile and additionally we run some expensive processing pipeline - this might explain high CPU usage. And we also saw that from the Parallel Stack window - that many threads are occupied with the same task.
Now we have to look deeper at how profiles are generated from RequestOptions.
But.. but… unit tests WERE GREEN!!!
Returning to Test Cases
Ok, let’s return to our test suite.
This test is GREEN!
1
2
3
4
5
6
7
8
9
10
11
12
13
14
15
16
17
18
19
20
21
22
23
24
25
26
27
28
29
30
[Fact]
public void RegisterTwoSimilarProfiles_ShouldBeOne()
{
    var sut = new ProfileStore();

    var p1 = new RequestOptions
    {
        IncludeCoordinates = true,
        IncludeName = true,
        TransportModeOptions =
        {
            IncludeAll = false
        }
    };

    var p2 = new RequestOptions
    {
        IncludeCoordinates = true,
        IncludeName = true,
        TransportModeOptions =
        {
            IncludeAll = false
        }
    };

    sut.RegisterProfile(p1);
    sut.RegisterProfile(p2);

    sut.ProfileCount.Should.Be(1);
}
Ok, let’s try to insert two different profiles:
1
2
3
4
5
6
7
8
9
10
11
12
13
14
15
16
17
18
19
20
21
22
23
24
25
26
27
28
29
30
31
32
[Fact]
public void RegisterTwoDifferentProfiles_ShouldBeTwo()
{
    var sut = new ProfileStore();

    // IncludeAll = false
    var p1 = new RequestOptions
    {
        IncludeCoordinates = true,
        IncludeName = true,
        TransportModeOptions =
        {
            IncludeAll = false
        }
    };

    // IncludeAll = true
    var p2 = new RequestOptions
    {
        IncludeCoordinates = true,
        IncludeName = true,
        TransportModeOptions =
        {
            IncludeAll = true
        }
    };

    sut.RegisterProfile(p1);
    sut.RegisterProfile(p2);

    sut.ProfileCount.Should.Be(2);
}
Again - test IS green! Whataheck? I’m assuming that distinct profile generation is working correctly..
After few minutes starring at screen and building in my mind various potential root causes for this issue, I realized that we do not have test case for inserting two identical profiles with IncludeAll = true.
Let’s create this test case then:
1
2
3
4
5
6
7
8
9
10
11
12
13
14
15
16
17
18
19
20
21
22
23
24
25
26
27
28
29
30
[Fact]
public void RegisterTwoTheSameProfiles_WithIncludeAllTrue_ShouldBeOne()
{
    var sut = new ProfileStore();

    var p1 = new RequestOptions
    {
        IncludeCoordinates = true,
        IncludeName = true,
        TransportModeOptions =
        {
            IncludeAll = true
        }
    };

    var p2 = new RequestOptions
    {
        IncludeCoordinates = true,
        IncludeName = true,
        TransportModeOptions =
        {
            IncludeAll = true
        }
    };

    sut.RegisterProfile(p1);
    sut.RegisterProfile(p2);

    sut.ProfileCount.Should.Be(1);
}
And KA-BOOM!!! Our test case is RED!
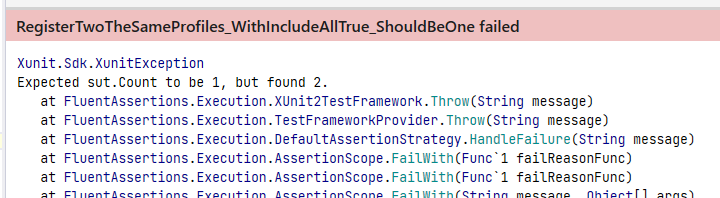
This proves that you have to be careful with your assumptions about what those tests are covering.
Fixing the Code
RequestOptions comparison was working correctly for IncludeAll = false but failed for IncludeAll = true. There must be something wrong with instance comparison logic.
Let’s take a closer look.
1
2
3
4
5
6
7
8
9
10
11
12
13
14
15
16
17
18
19
20
21
22
23
public class RequestOptions : IEqualityComparer<RequestOptions>
{
    public bool IncludeCoordinates { get; set; }
    public bool IncludeName { get; set; }
    public TransportModeOptions TransportModeOptions { get; set; } = new();

    public override bool Equals(object obj)
    {
        return Equals((RequestOptions)obj);
    }

    public bool Equals(RequestOptions x, RequestOptions y)
    {
        ...

        if (!TransportModeOptions.Equals(x.TransportModeOptions))
        {
            return false;
        }

        return true;
    }
}
At first look, seems quite OK-ish (yeah, we could do some code formatting and other nitties but overall logic seems to be correct)! We are comparing all properties of the passed in objects and if something is different - returning false flagging that instances differ.
But there is something wrong with TransportModeOptions.IncludeAll property..
“Look closer! Look cloooooser mate!” voice in my head started to shout louder and louder..
1
2
3
4
public bool Equals(RequestOptions x, RequestOptions y)
{
    if (!TransportModeOptions.Equals(x.TransportModeOptions))
    {
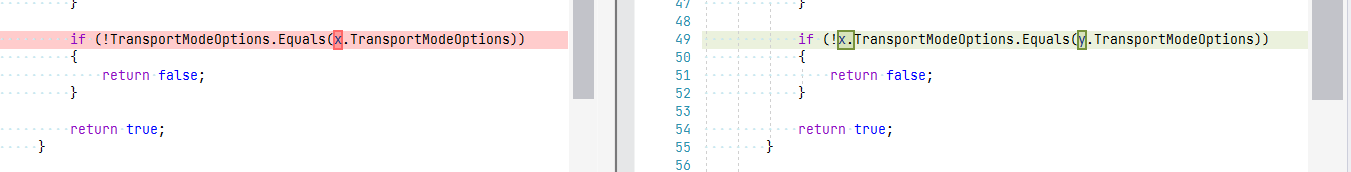
WTF?? I took next glass of semi-sweet red wine at late night.. realizing that we were ignoring y in this comparison logic…
So what’s going on here?
We are comparing default value of TransportModeOptions property with value of argument x - completely ignoring passed in argument y. Meaning that every time we are adding profile with any values other than produced by TransportModeOptions { get; set; } = new(); statement - we will get false as result of instance comparison logic.
This also answers our second question - “And why this happens only after few hours or even days of gRPC service uptime?”.
Requests with IncludeAll = true comes really rare from the consuming application. So number of profiles builds up over the time. Therefore immediate effects were not visible.
Fix for the mysterious issue is really simple (yet again - 1 liner):
Fixing the Code for Real
What’s wrong with the code above? RequestOptions is doing too much. It’s holding data for the request AND also provides comparison logic. Which also proves that code below looks a bit weird:
1
2
3
4
5
6
7
public class ProfileStore
{
    private ConcurrentDictionary<RequestOptions, QuayProfile> _profiles
        = new(new RequestOptions());

    public void RegisterProfile(RequestOptions options)
    {
Why do I pass in RequestOptions instance when creating new ConcurrentDictionary (= new(new RequestOptions()))?
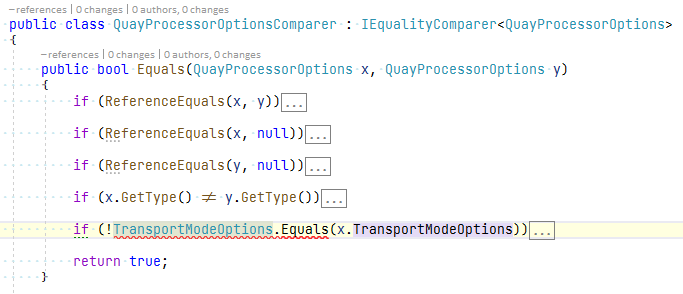
In my opinion better structure would be to “extract” comparison into separate class:
1
2
3
4
5
6
7
public class QuayProcessorOptionsComparer : IEqualityComparer<QuayProcessorOptions>
{
    public bool Equals(QuayProcessorOptions x, QuayProcessorOptions y)
    {

    }
}
Which also gives cleaner ConcurrentDictionary instantiation code:
1
2
private readonly ConcurrentDictionary<QuayProcessorOptions, QuayDataProfile>
    _profiles = new(new QuayProcessorOptionsComparer());
Plus additional bonus would be getting compilation time error with original code:
Lessons Learned
- Don’t assume anything when looking at unit test run results
- Review and revisit test cases and see for potentially uncovered cases (this might be fixed by using some data mocker like
AutoFixtureto stress test variations of the profiles andProfileStorebehavior when receiving such instances ofRequestOptions). - Constantly monitor your apps
- Learn the tools in your belt
- Be patient. Hard-core debugging is neither easy nor fast!
Happy debugging!
[eof]
Comments powered by Disqus.