Discovering Most Stupid Mistake I Ever Made - Analyzing gRPC Service MemDump from Linux based Docker Running on ACI
This is yet another story from the series about building public transportation tracking system on Microsoft Azure.
Here we are going to discover one of the most stupid mistake I could ever made in my career. The turning point was an informal conversation with the one and only Tess Ferrandez.
Background
For those who were following this blog post series I will repeat here. We need to describe crime scene background.
Our public transportation tracking system is running on Microsoft Azure utilizing Web Jobs, Service Bus, Event Grid, gRPC for .NET, Azure Container Instances and many other services. Sometimes data flow chain might be pretty long and any link could break.
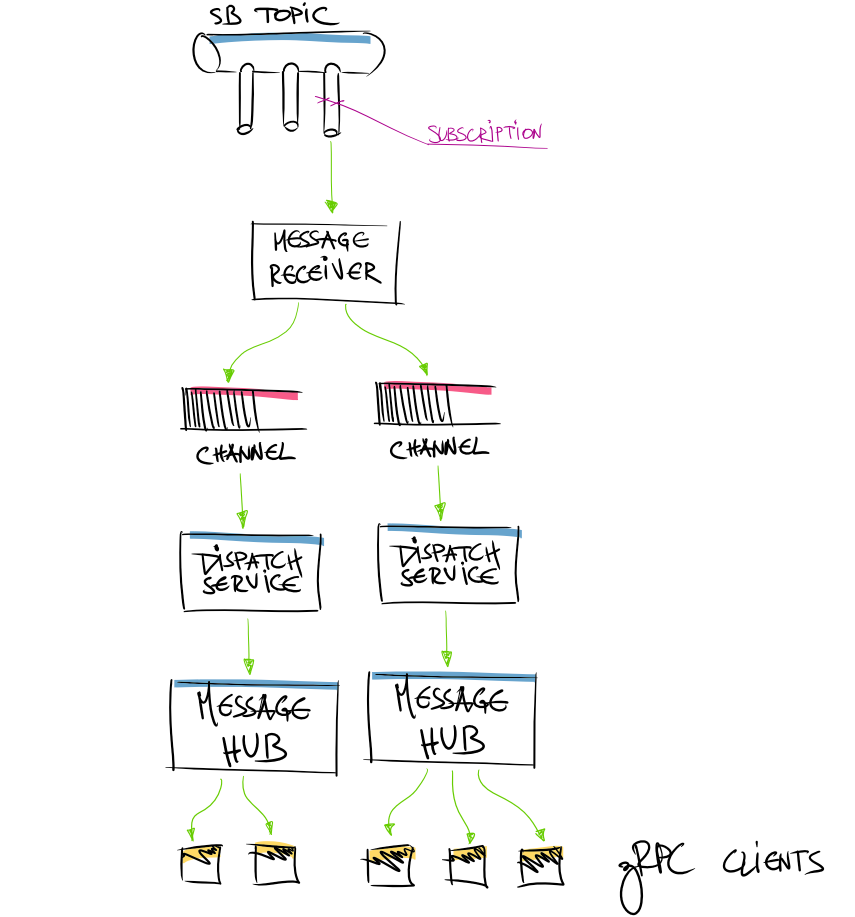
A quick recap of what we have in Azure for the gRPC service to operate:
- data is collected on regular bases via Azure Functions
- then heavy lifting to do all required computations is done in WebJob
- WebJob drops newly generated snapshot on Service Bus topic
- gRPC listens on the Service Bus topic subscription
- Received data is prepared, filtered, sliced and broadcasted to connected clients
Data flow is the application is somewhat along these lines:
The Problem
Over the time (usually couple days of uptime) gRPC service is not broadcasting data anymore to connected clients. New connection could be established - meaning that gRPC service is alive - but no new data is broadcasted. gRPC service restart helps. With the fresh start everything is back to normal until next occurrence. But that’s a treatment only till next time.
We are running gRPC service in Azure Container Instances. This means that we have to pack up diagnostics tooling along the Docker image and re-deploy the service.
Preparing Docker Image with .NET Diagnostic Tools
Adding .NET diagnostics tools to the docker image is simple as running bunch of copy commands. Fortunately diagnostic tools are available as .NET global tool - meaning that installation is super easy and smooth.
1
2
3
4
5
6
7
8
9
10
11
12
13
14
FROM mcr.microsoft.com/dotnet/sdk:5.0-focal AS build

# install diagnostics tools
RUN dotnet tool install --tool-path /tools dotnet-trace
RUN dotnet tool install --tool-path /tools dotnet-counters
RUN dotnet tool install --tool-path /tools dotnet-dump
RUN dotnet tool install --tool-path /tools dotnet-gcdump

...

# copy diagnostics tools to final layer
FROM mcr.microsoft.com/dotnet/aspnet:5.0-focal AS final
WORKDIR /tools
COPY --from=build /tools .
With this fragment of Dockerfile following .NET diagnostics tools will be copied and available in Docker container which we are using for hosting gRPC service:
dotnet-trace- for collecting events from running process. More info here.dotnet-counters- if we would need to review and investigate counters on the image (like CPU or rate of exceptions thrown, etc); More info here.dotnet-dump- this is most important tool when you want to see what process has in memory. More info here.dotnet-gcdump- if you need to see what’s on GC mind or why still some of the objects are in memory and who needs those? More info here.
Not all of them will be used this time, but it’s always good to have right tools at your disposal when needed.
More information could be found here.
Now that we have packed .NET diagnostics tools inside the image, we can redeploy the image and run it again on ACI.
Mounting Volume for Dumps
In order to run .NET diagnostics tools and analyze results offloaded from Docker container instance - we need to have permanent storage that is not part of Docker container file system. Otherwise on next restart file system of the container will be gone and fresh new will be mounted from container image. To do so - we have utilize Azure Storage File Share service and use file share to mount it to Docker container and have a storage where we could move and store taken dumps.
Remember that volume mounting on ACI service is available only for Linux based images.
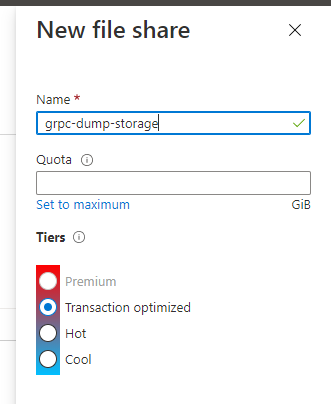
Creating Azure Storage File Service
Mount File Share to Docker Image
I’m using YAML files to deploy ACI containers - so we gonna edit a bit this beast. First you need to define where you would like to mount attached volume (part of your container properties collection in your ACI YAML description file):
1
2
3
  volumeMounts:
  - mountPath: /aci/logs/
    name: filesharevolume
And then you can define from there this volume is coming from:
1
2
3
4
5
6
  volumes:
  - name: filesharevolume
    azureFile:
      sharename: grpc-dump-storage
      storageAccountName: grpccontainerfileshare
      storageAccountKey: 123...abc==
Property storageAccountKey is just your storage SAS token (access key) and sharename is name of the share we just created.
Relevant YAML file fragments for completeness:
1
2
3
4
5
6
7
8
9
10
11
12
13
14
15
16
17
18
19
api-version: 2018-10-01
location: westeurope
name: grpc-container
properties:
  containers:
  - name: grpc-app
    properties:
      volumeMounts:
      - mountPath: /aci/logs/
        name: filesharevolume
      ...
  osType: Linux
  volumes:
  - name: filesharevolume
    azureFile:
      sharename: grpc-dump-storage
      storageAccountName: grpccontainerfileshare
      storageAccountKey: 123...abc==
type: Microsoft.ContainerInstance/containerGroups
Taking Memory Dumps
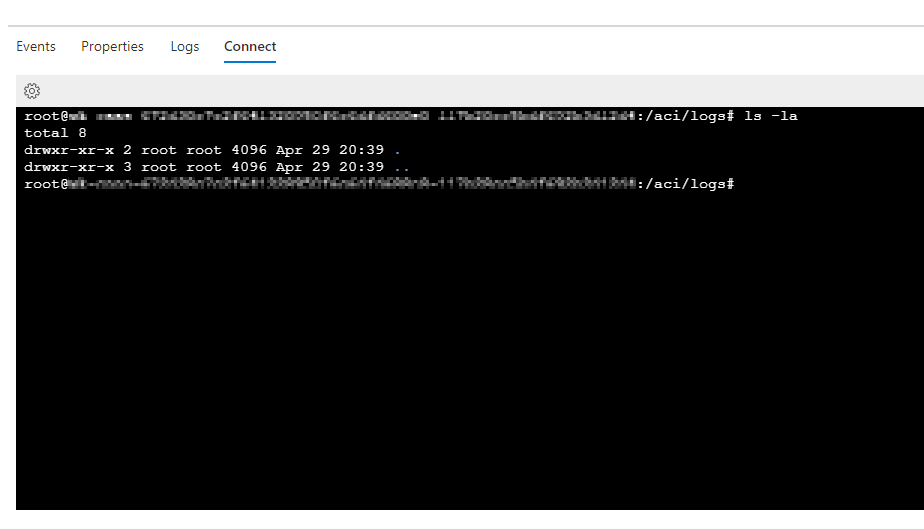
Now we have redeployed gRPC service with .NET diagnostics tools and new volume mapping. By checking content of the /tools directory - see all included tools:
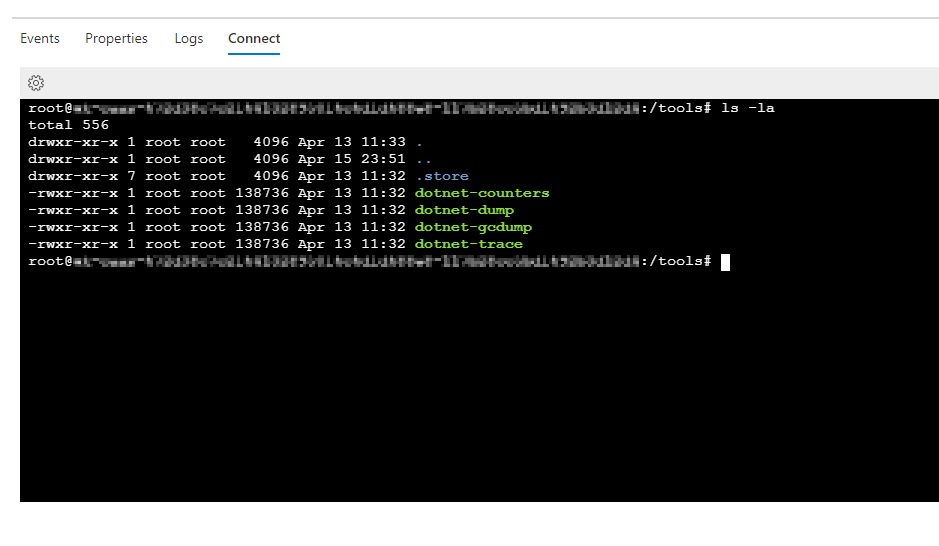
We can see this mount is as expected - just yet another folder in the file system.
Enlisting Applicable Processes
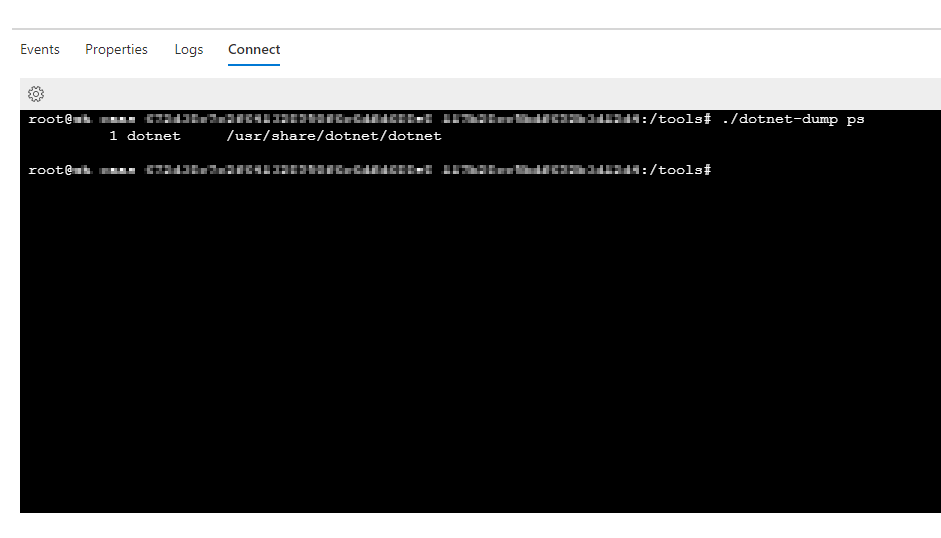
First thing we have to do is to list all applicable processes for memory dump. This is done by command:
1
user@machine:/tools# dotnet-dump ps
As result we see only single .NET process:
Taking a Dump
In order to take a memory dump - it’s super easy:
1
user@machine:/tools# ./dotnet-dump collect -p 1
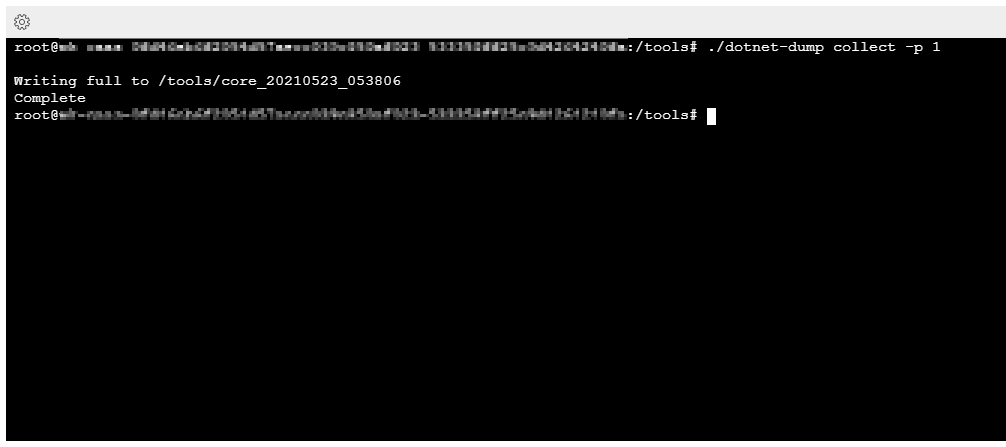
Executing collect command dump tool will write dump file to the /tools directory.
Now we can move file to our shared mounted volume and later download to development machine to start analyze it further in Visual Studio.
NB! You can also analyze it right there inside the docker image by executing:
1
user@machine:/tools# ./dotnet-dump analyze core_20210523_053806
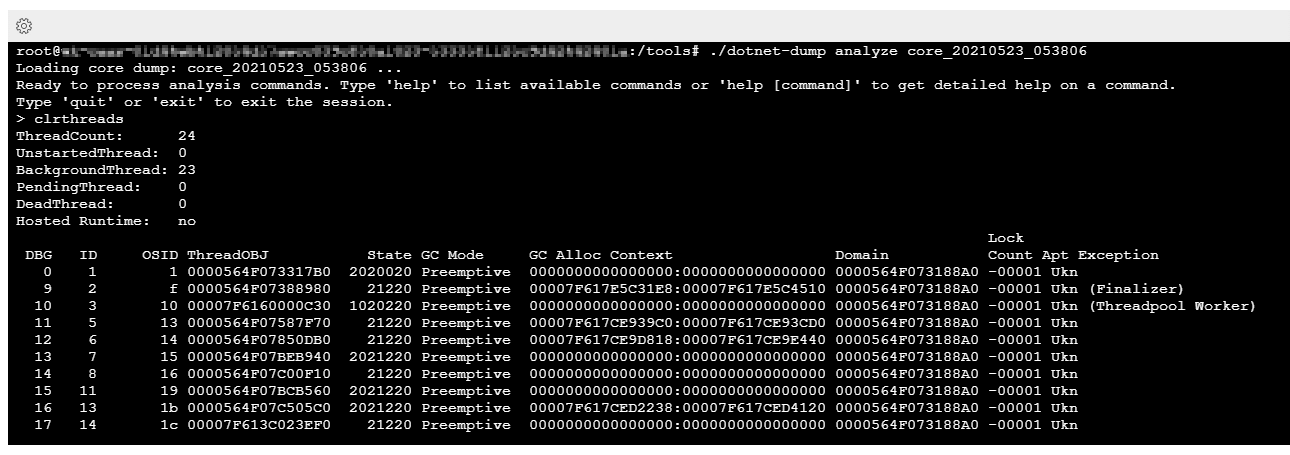
But I just prefer some user interface and more interactive environment compared to command-line interface.
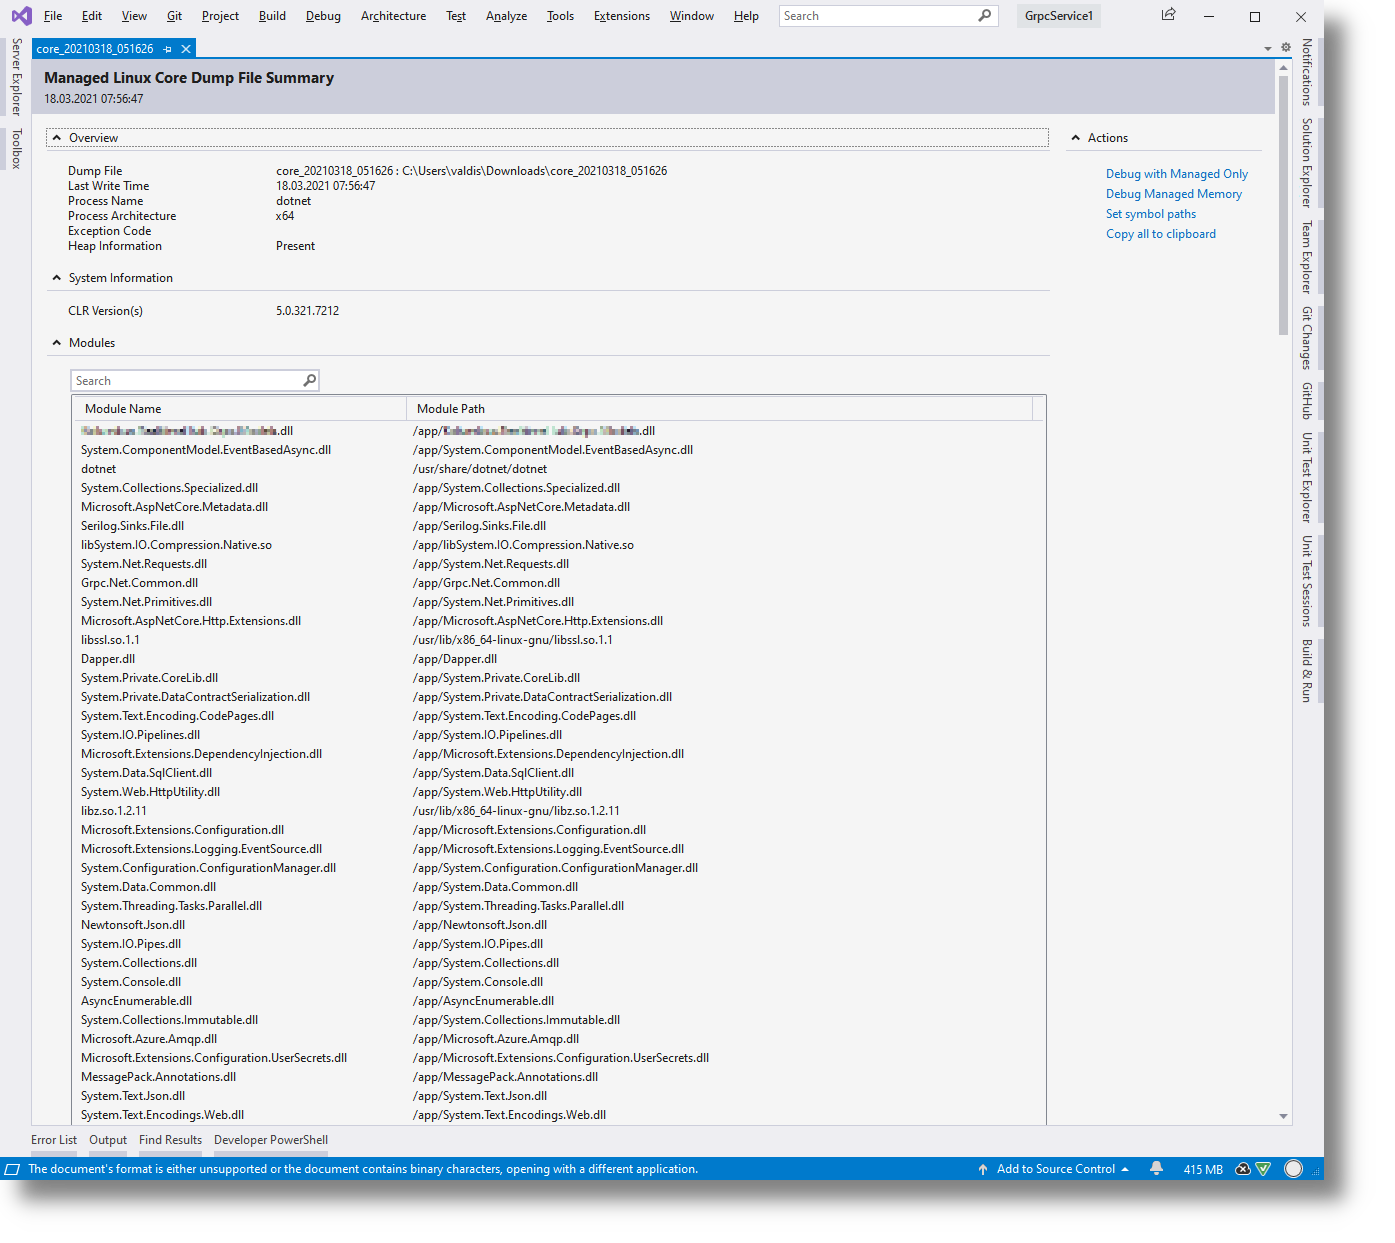
Analyzing Dump in Visual Studio
It’s amazing that we can open and analyze process dumps taken from Linux based docker image directly in Visual Studio. Windbg is all nice and cool - but sometimes I’m just way too lazy and better spend some mouse clicks than typing and navigating through address space in command-line interface.
We can just open dump file in Visual Studio and it will gives familiar choices:
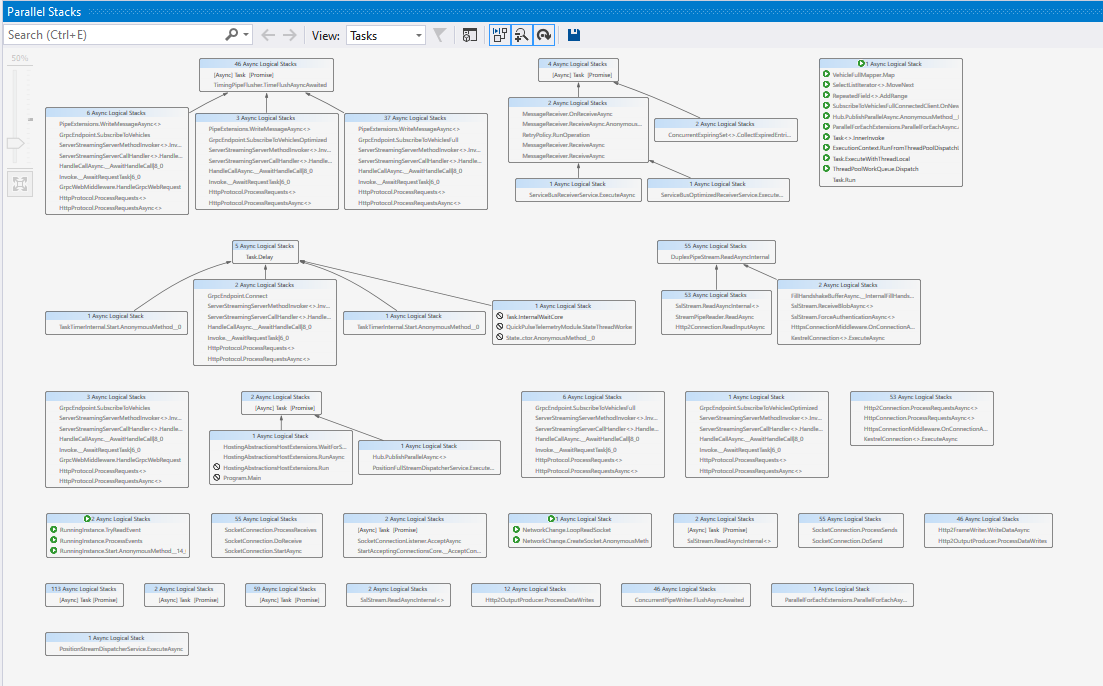
When it comes to parallel / async code debugging experience - Parallel Stacks is invaluable tool to visualize what’s going on in your application.
This is state of the app when I took a memory dump when gRPC service was stalled.
Btw, you can do the same also in command-line interface also (thanks to Christophe Nasarre and friends at Criteo).
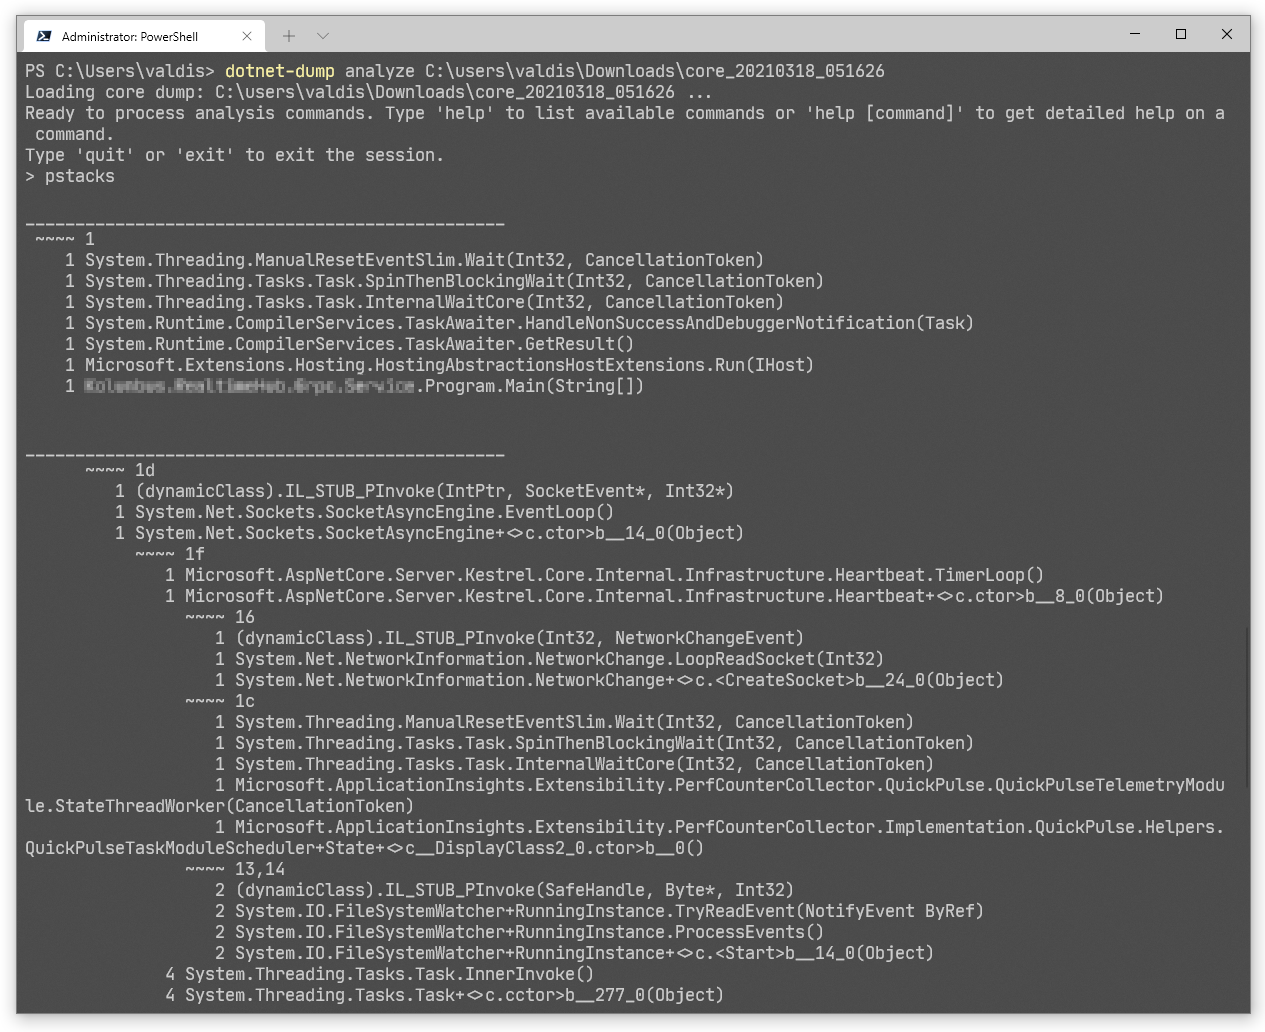
What Do We Have Here?
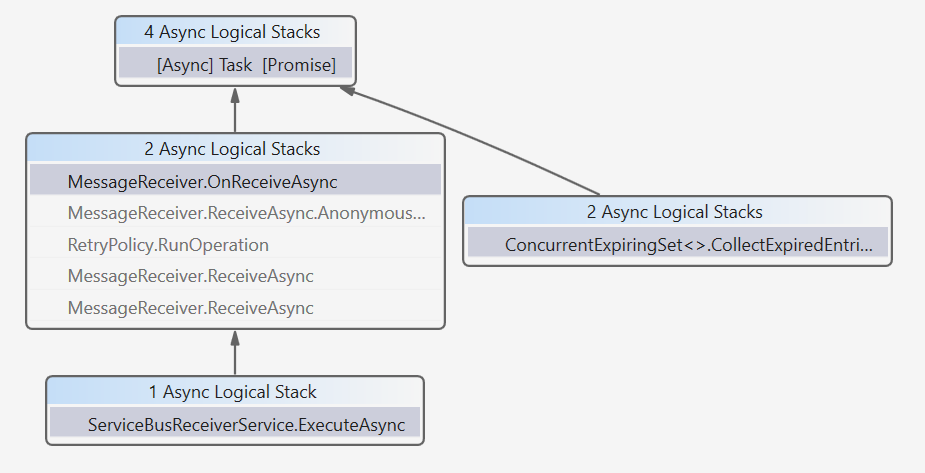
We know that initial entrance for the data flow in gRPC service is via Service Bus receiver background service. Checking Parallel Stacks for the evidence - we can see that we do have Task awaiting state - which means that Service Bus receiver is alive and is just sitting and waiting for new messages to arrive:
Next thing is to check what’s the status of the channels (System.Threading.Channels.Channel<T>) we used to communicate from Service Bus receiver to gRPC service.
Service Bus receiver has reference to all the channel abstractions (we use those just to hide dependency on Channel<T>). It’s pretty simple abstraction:
1
2
3
4
5
6
7
8
9
10
11
12
13
14
15
16
17
18
19
20
21
22
23
public class DefaultStreamChannel
{
    private readonly Channel<WorkItem> _channel;

    public DefaultStreamChannel(IOptions<AppConfig> config)
    {
        _channel = Channel.CreateBounded<WorkItem>(
            new BoundedChannelOptions(config.Value.GrpcClientChannelBufferSize)
            {
                AllowSynchronousContinuations = false,
                SingleReader = true,
                SingleWriter = false,
                FullMode = BoundedChannelFullMode.DropOldest
            });
    }

    public ChannelReader<WorkItem> Reader => _channel.Reader;

    public bool Publish(WorkItem data)
    {
        return _channel.Writer.TryWrite(data);
    }
}
So we can jump on awaiting Task and inspect channel states from there:
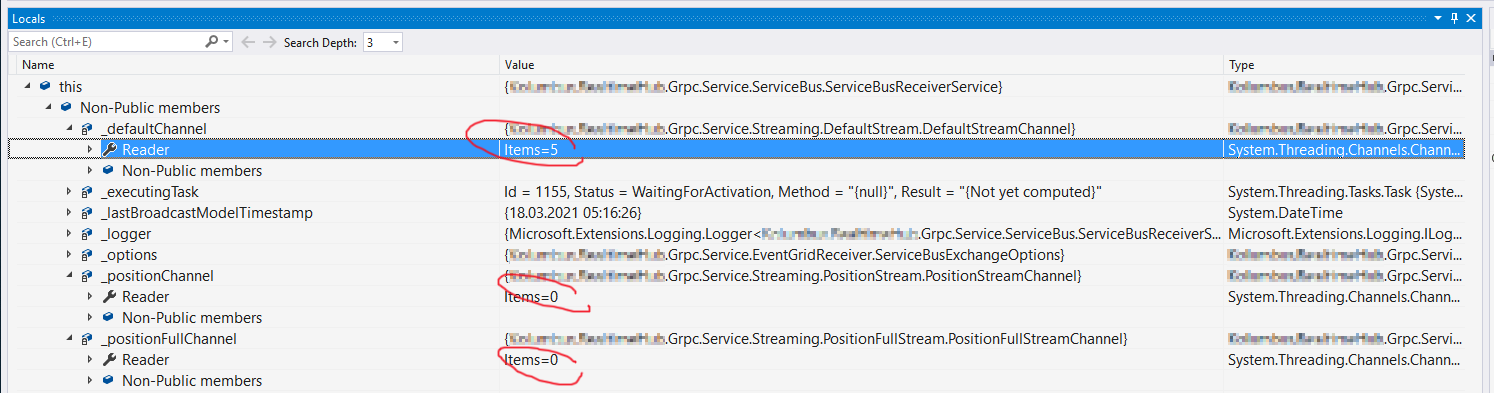
We have defined buffer to be of size 5 items between Service Bus and gRPC. As highlighted in the image above - it’s SUPER WEIRD that other channels are cleared but one of the them is stuck with 5 items in the buffer and are not processed.
Discovering The Biggest Mistake I Could Ever Make
As we saw interesting is that channel capacity is taken, Reader is full and no new items being pushed through the channel. It’s weird indeed.
We have dedicated channel and dispatch background service for every data streams in gRPC. In order for data to flow Service Bus receiver, buffer channel in between, data dispatch background service should be working. We checked that Service Bus receiver is alive (we have awaiting task on new message to arrive) - however channels is full and no new messages are processed.
Next thing we can check - what about scheduled task for the reader side of the channel - AND THERE WAS NONE! No task for reader, nothing.. No evidence of dispatch background service existence!
Back to basics. I revisited facts what had collected so far:
- data comes in from Service Bus topic
- SB message receiver is alive and posts messages to channel(-s)
- there is a dedicated background service for reading the channel
- message is processed and prepared for the broadcast
- then message is forwarded to message hub
- message hub has list of subscribers (gRPC connected clients)
- each subscriber receives message copy and is able to do the write to the stream
There is somewhere an issue along these lines..
And then suddenly as from the clear skies - what if… just a thought.. what if there is an unhandled exception in that dedicated background service for the full channel??
Background services are initialized at startup and code that does this is pretty straightforward.
This is callstack from where initialization is called:
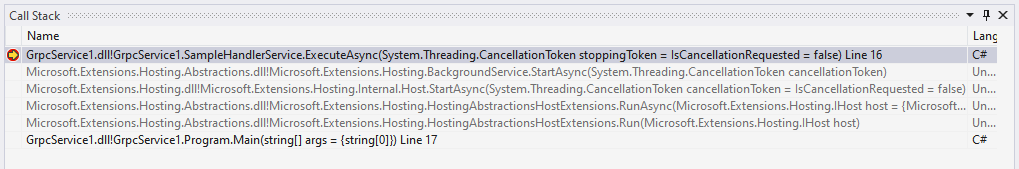
Browsing Microsoft.Extensions.Hosting namespace understood that it’s just simple “find all IHostedService instances and call StartAsync method”. As we are inheriting from BackgroundService base class - we have to implement just ExecuteAsync method (which is called at StartAsync in BackgroundService).
If exception is thrown in background service (async code) - it’s basically swallowed by the runtime. There will be no clear evidence that exception was thrown, application will not be terminated.
Our gRPC service was made with huge flow - if any of subscribers will throw an exception - whole “broadcast” process is aborted and data is not pushed to any of the subscribers. Resulting in stuck gRPC service. The only cure is to restart the app. This is of course not accepted solution.
After experimenting with few code samples and try outs - we found out that the problem is located incoming dataset. We had an exception while we were preparing data for the broadcast (int.Parse). That’s why we had super weird behavior of the service - gRPC service failed “sometimes”. Like it could failed for 3 or 4 times a week. Sometimes more frequent sometimes less..
That all contributed to hard-to-find bug.
Hard Lesson Learned
I was super happy to discover this nasty little thing. But I could not discover it alone. Informal chats, couple idea and just expressing your findings or suspicions out loud - will help A LOT!
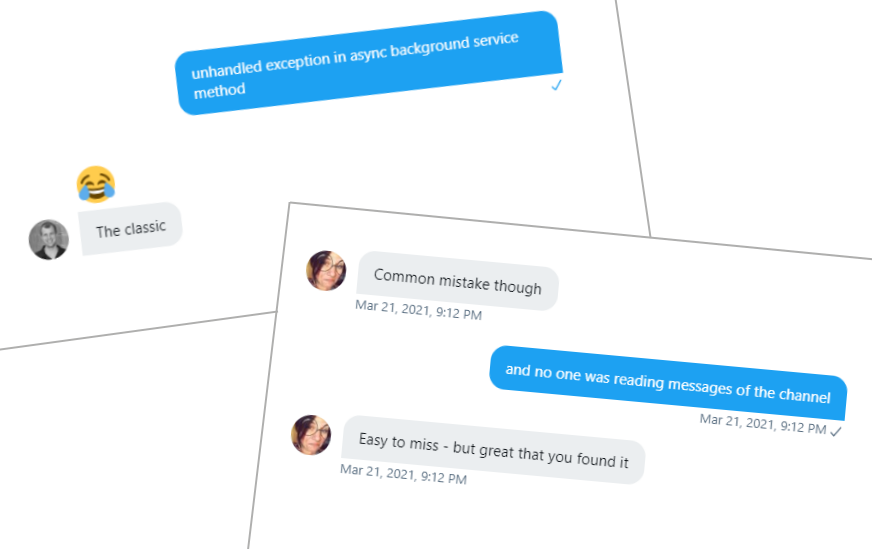
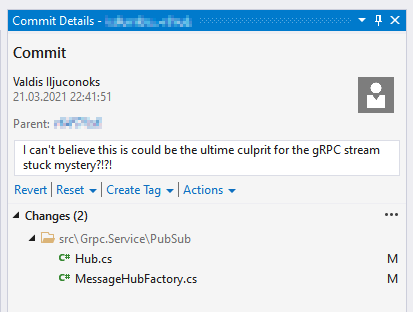
It’s like 1 liner with huge impact!
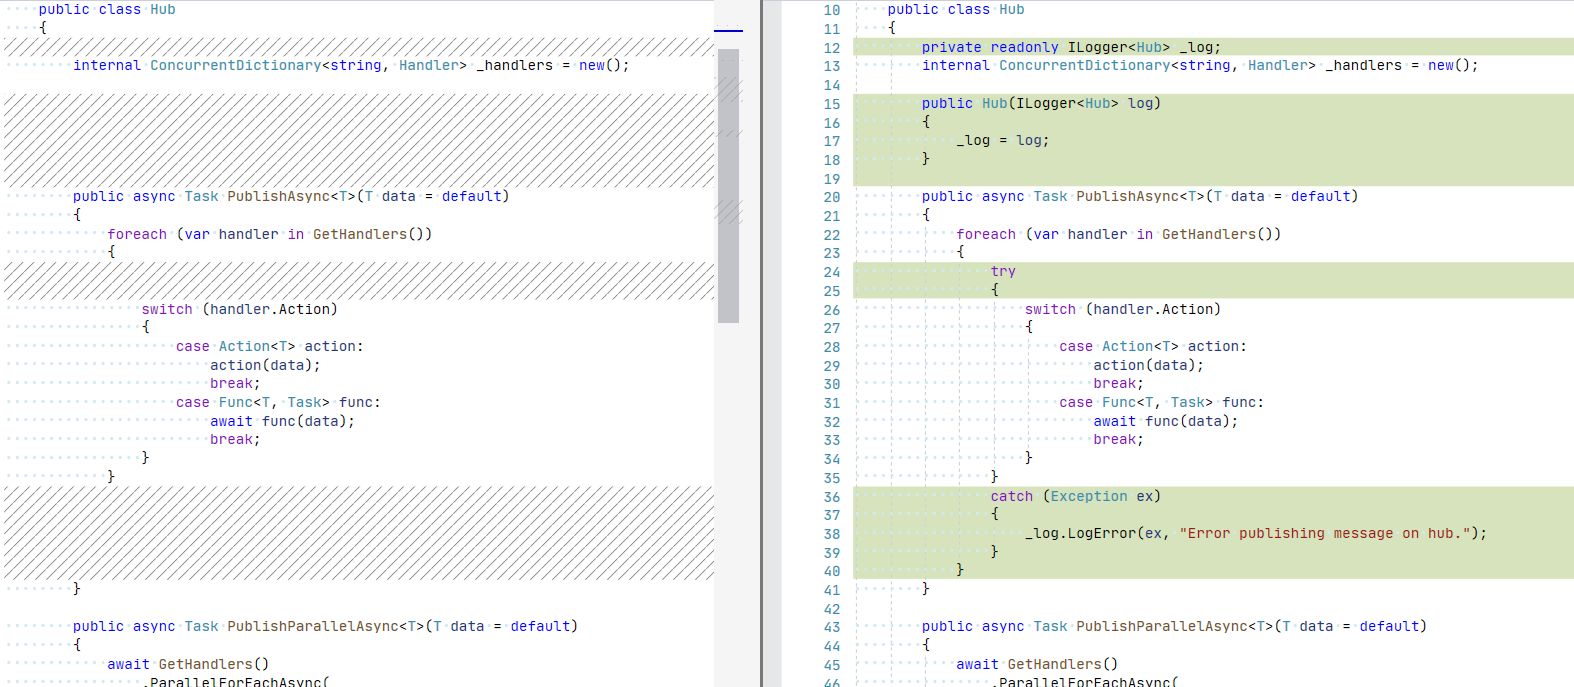
In summary: when you are dealing with async code - think through of exception handling process and dataflow. Beware that exceptions might be swallowed - leaving you wondering.. Application will continue to run with invalid state.
Btw, one of the easiest way to observe all first chance exceptions is to subscribe to the event in app domain:
1
2
3
4
5
6
AppDomain.CurrentDomain.FirstChanceException += OnFirstChanceException;

private static void OnFirstChanceException(object sender, FirstChanceExceptionEventArgs e)
{
    // do some magic here
}
Happy debugging!
[eof]
Comments powered by Disqus.